

These are the latest coronavirus figures in Wakefield and the Five Towns, broken down by age group - plus how many people in each age bracket have been vaccinated. All data courtesy of Public Health England/NHS England. Case numbers cover the period up to June 16, while vaccination figures are accurate up to June 13. Click here to view the latest Covid infection rates for every neighbourhood in the Wakefield district.
5. 60-64
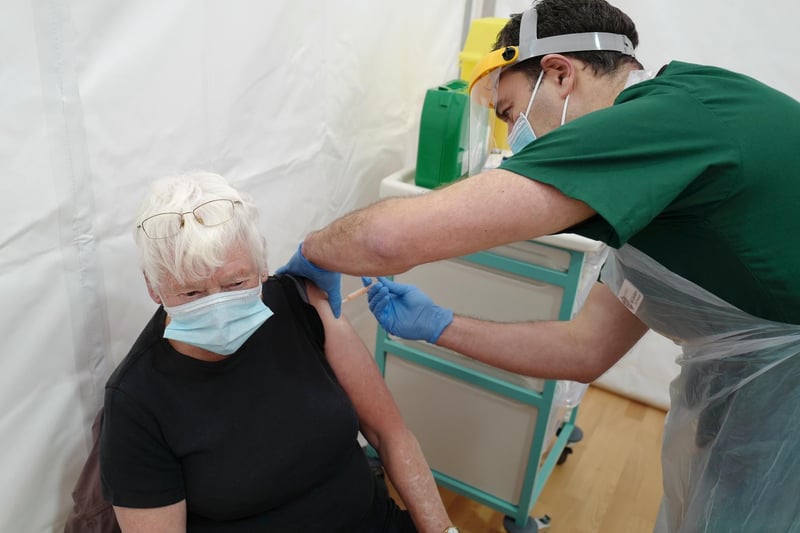
In the seven days up to June 16, seven cases of Covid-19 were confirmed among those aged 60 to 64, bringing the rolling rate to 33.6 per 100,000 people. According to the latest figures from NHS England, 99.2% of people in Wakefield in this age group have had one dose of a Covid vaccine, and 93.5% have received both doses.
6. 55-59
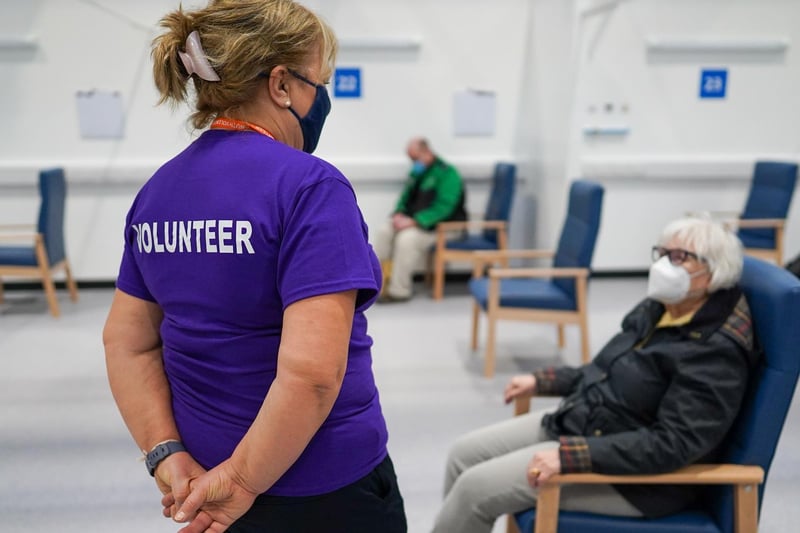
In the seven days up to June 16, nine cases of Covid-19 were confirmed among those aged 55 to 59, bringing the rolling rate to 37.2 per 100,000 people. According to the latest figures from NHS England, 98.4% of people in Wakefield in this age group have had one dose of a Covid vaccine, and 89.8% have received both doses. Photo: Photo by Ian Forsyth/Getty Images
7. 50-54
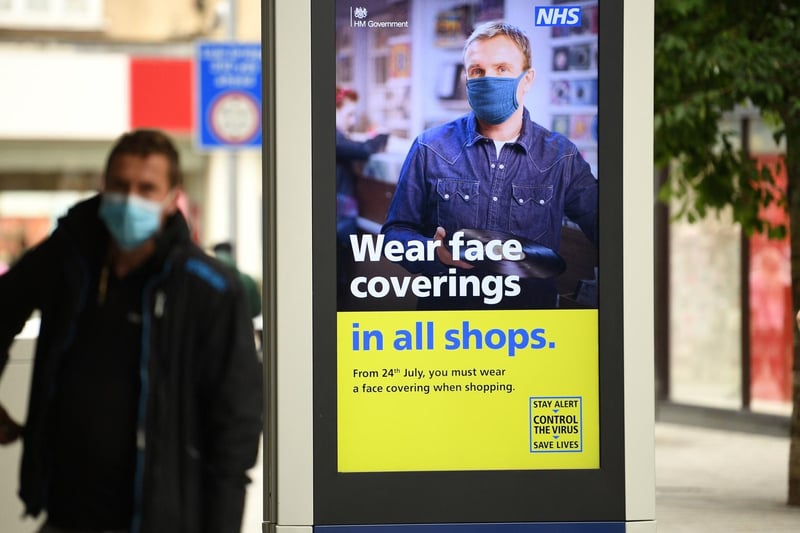
In the seven days up to June 16, 10 cases of Covid-19 were confirmed among those aged 50 to 54, bringing the rolling rate to 38.8 per 100,000 people. According to the latest figures from NHS England, 95.6% of people in Wakefield in this age group have had one dose of a Covid vaccine, and 82.3% have received both doses.
8. 45-49
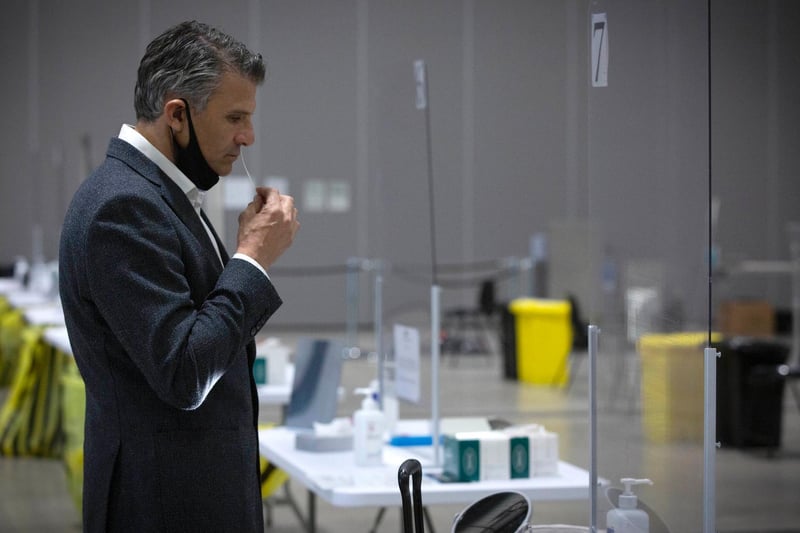
In the seven days up to June 16, 14 cases of Covid-19 were confirmed among those aged 45 to 49, bringing the rolling rate to 58.6 per 100,000 people. According to the latest figures from NHS England, 84.6% of people in Wakefield in this age group have had one dose of a Covid vaccine. Photo: Colin McPherson/Getty Images